Partners in Excellence
Role-aware dashboards that cascade from organization to team
Five role-based Power BI views across clinical, financial and HR data, designed to cut context switching.
- Role
- UX/UI designer
- Scope
- Technical assessment, User journeys, Dashboard design, Design guidelines
- Tools
- Power BI, Figma
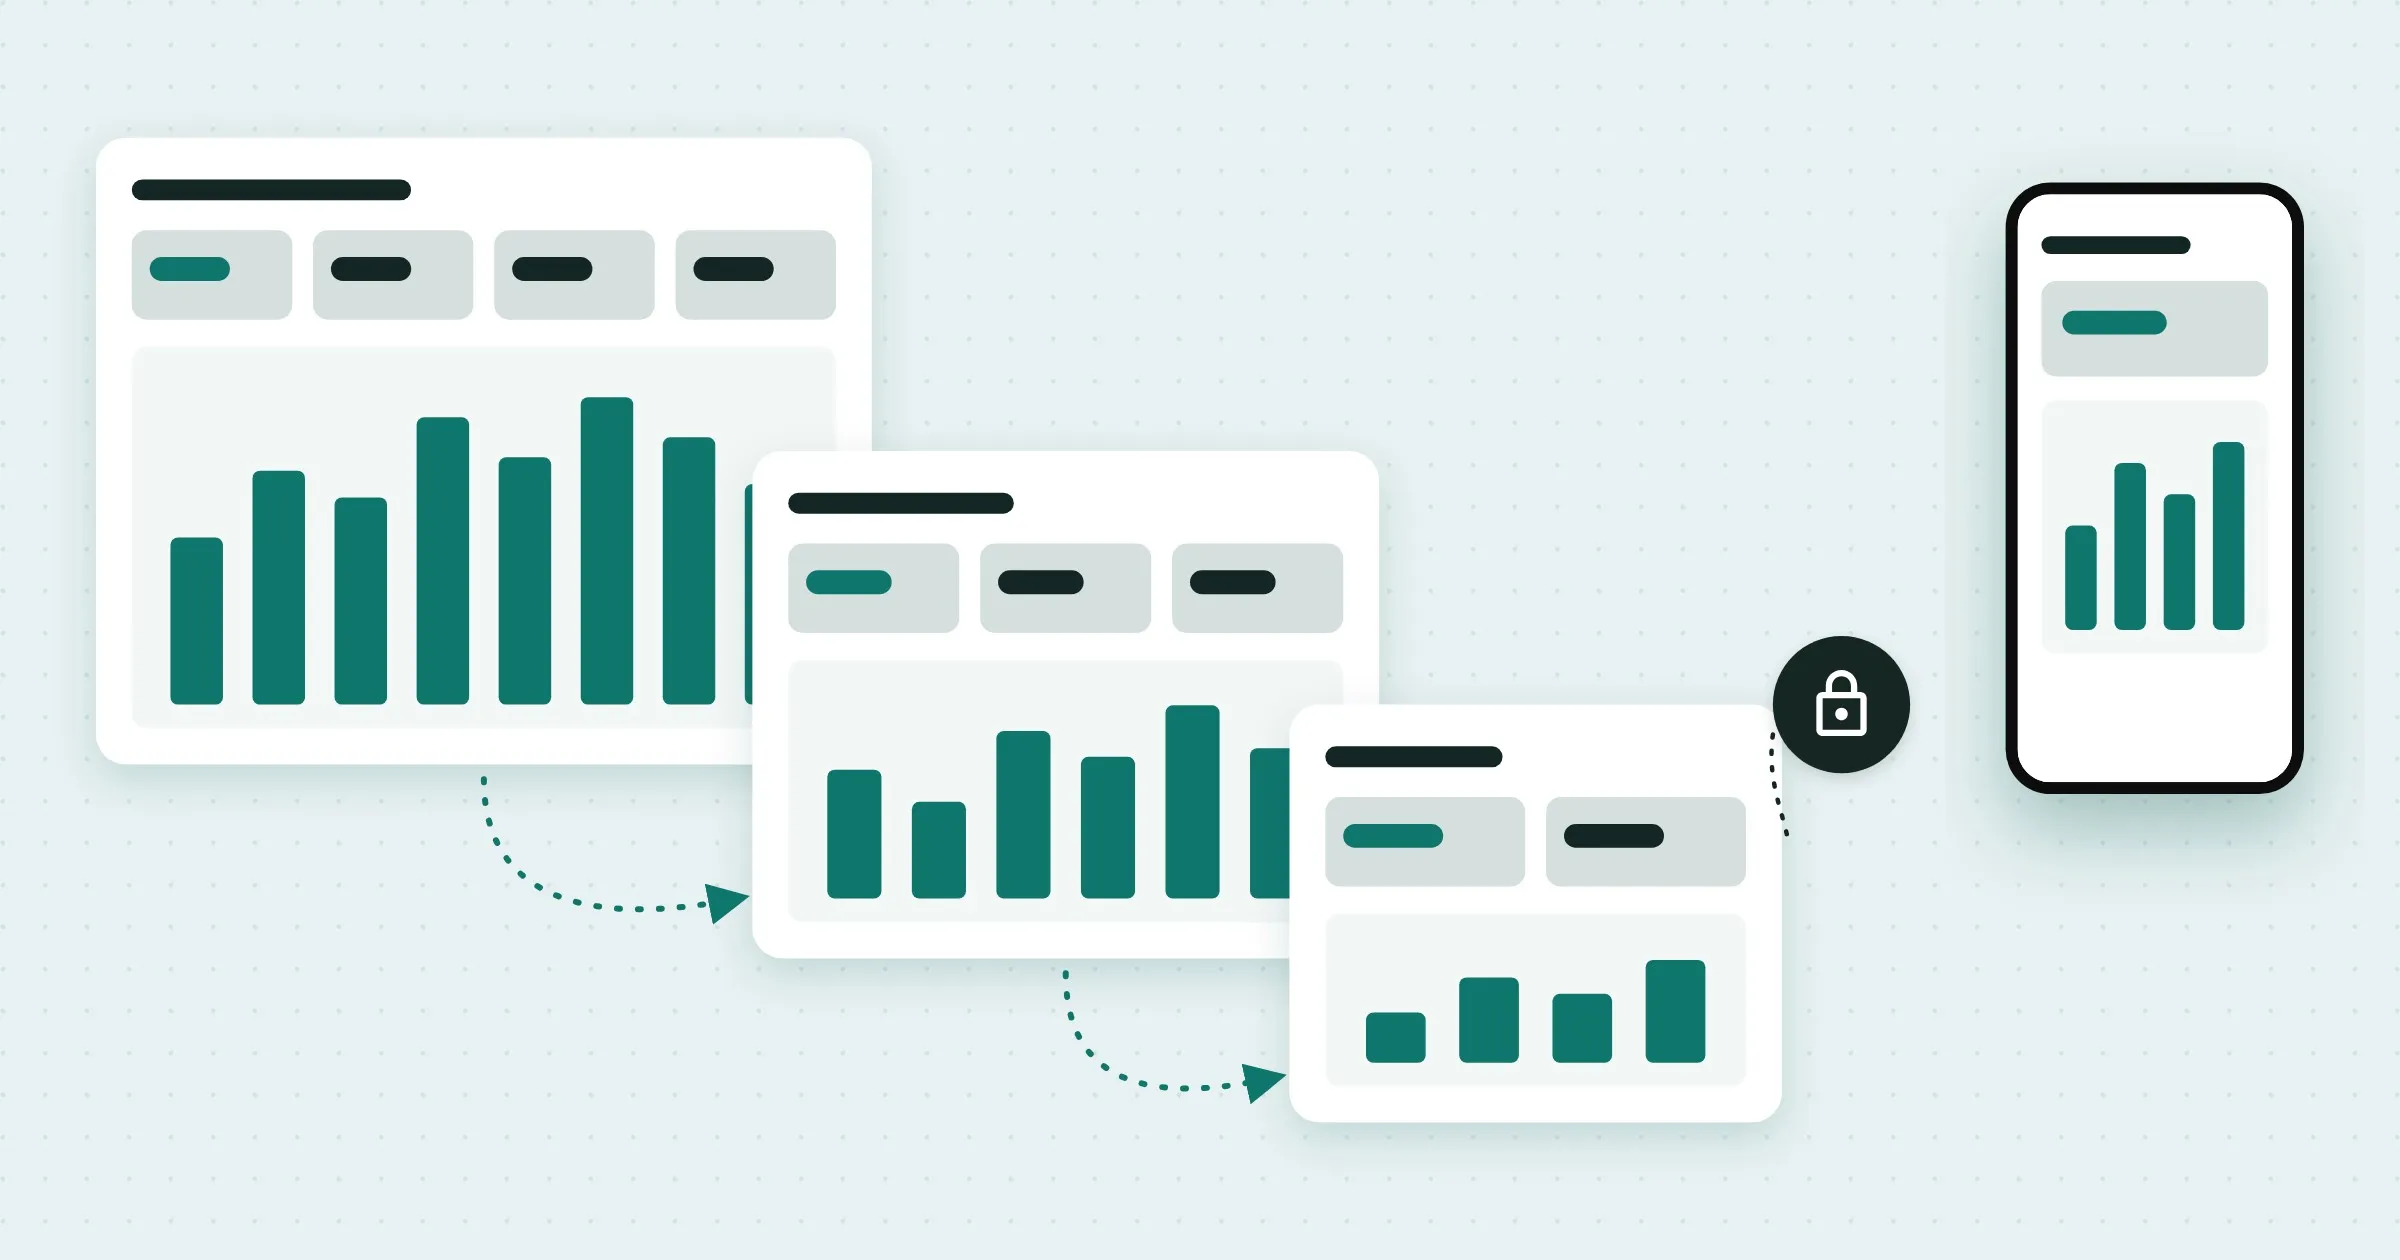
With cross-functional stakeholders, I designed one reporting dashboard spanning clinical, financial and HR systems, built to cut the context switching between them.
How the work ran
Assess
The current state of reporting, with stakeholders.
Design the cascade
Five role-based views, from the organization down to teams.
Set guidelines
Chart guidelines for desktop and mobile.
1Assess
With stakeholders, I assessed the current state and designed a future-state framework for the dashboard.
2Design the cascade
I architected a “cascade of granularity”: five role-based views that run from the whole organization down to individual teams, aligned with row-level security so each person sees what their role allows.
3Set guidelines
I set chart guidelines for desktop and mobile, so every view reads the same way.
More dashboard viewsMore of the dashboard views.Password required